Level 1 vs. Level 2 EV Charging 2026 Tool (Guide & Data)
Choose Level 1 or Level 2 home EV charging from daily miles, dwell time, winter conditioning, vehicle acceptance, circuit capacity, installation, tariffs, and a measured recoveryday test.
The Short Answer
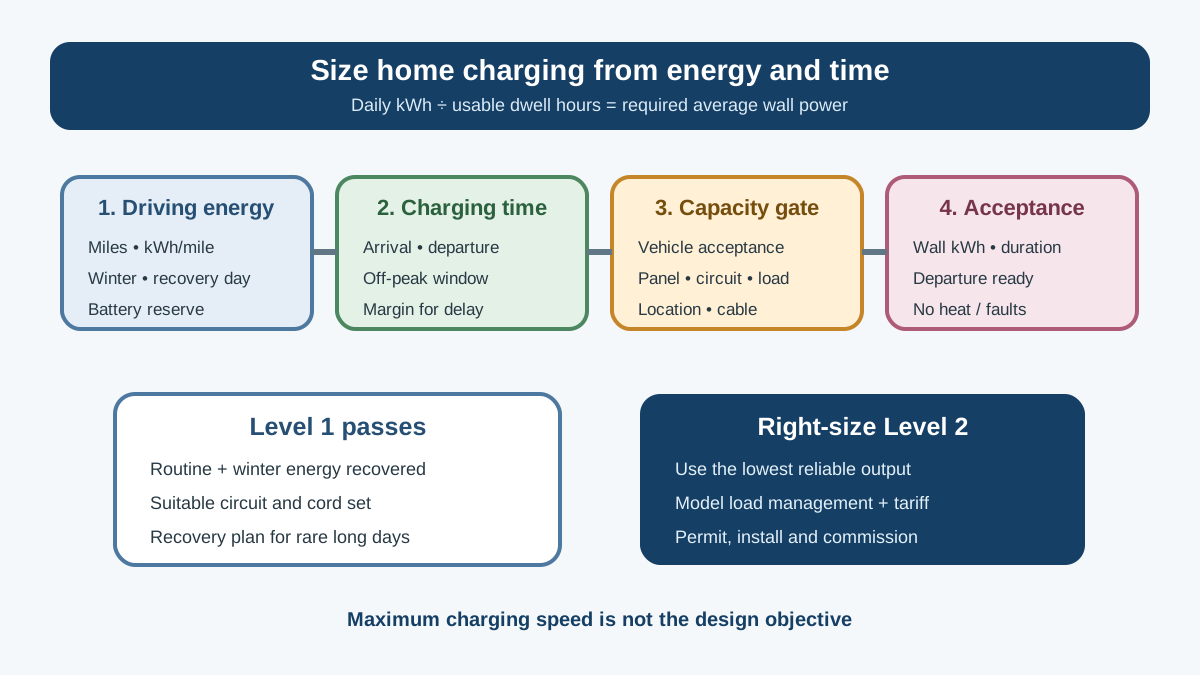
Short Answer: Level 1 can be an adequate primary home-charging solution when a compatible 120-volt circuit, the vehicle's cord set, daily driving, and overnight dwell window reliably replace the energy used. Level 2 is appropriate when Level 1 cannot recover routine driving, winter battery conditioning consumes too much of the window, two vehicles share limited hours, off-peak periods are short, or faster recovery is valuable. Do not install the highest amperage by default.
Start with daily battery energy, not advertised miles per charging hour. Then check the vehicle's AC acceptance limit, safe continuous circuit capacity, charger/cord-set rating, parking location, cable reach, weather exposure, panel/service capacity, utility tariff, permit, and installation. Commission the result by measuring wall kWh, charge time, vehicle energy added, connector temperature/condition, and departure readiness.
Level 1 and Level 2 Define AC Supply Categories
In typical North American residential use:
- Level 1 supplies AC charging from a nominal 120-volt source through compatible equipment.
- Level 2 supplies AC charging from a nominal 208/240-volt source through compatible equipment.
The equipment between the building supply and vehicle is electric vehicle supply equipment (EVSE). The vehicle's onboard charger converts AC to the form needed by its battery. A wall-mounted “charger” does not force the battery to accept its full nameplate power; the vehicle, EVSE, circuit, temperature, battery state, and controls establish the actual rate.
ENERGY STAR's consumer guidance uses driving pattern and vehicle type as first screening inputs and notes that Level 1 is slower while Level 2 requires a higher-power circuit and professional installation. Treat published miles-per-hour ranges as orientation. Vehicle efficiency, weather, speed, elevation, accessories, and battery conditioning change miles gained.
The Daily-Energy and Charging-Window Map
Complete this worksheet:
| Input | Normal weekday | High-mile/recovery day | Cold-weather case |
|---|---|---|---|
| Distance driven | |||
| Measured vehicle energy per distance | |||
| Battery energy to replace | |||
| Arrival state of charge | |||
| Required departure state | |||
| Plug-in window | |||
| Off-peak window | |||
| Estimated wall energy | |||
| Required average wall power | |||
| Vehicle AC acceptance limit | |||
| Departure-ready margin |
If Level 1 passes normal days but not the rare recovery case, public/workplace charging or occasional longer dwell may be cheaper than new high-power infrastructure. If missed recovery would disrupt essential travel, value that reliability explicitly.
Step 1: Estimate Daily Battery Energy
Use vehicle trip and charging records when available. A basic method is:
Daily battery energy = distance × battery energy per distance
If a vehicle averages 0.30 kWh/mile from the battery over the relevant season and travels 32 miles:
32 × 0.30 = 9.6 kWh from the battery
Wall energy will be higher because charging and battery conditioning have losses. Do not impose one universal percentage. Measure wall-to-battery results for the vehicle, temperature, power level, and state-of-charge range, or use a transparent low/base/high allowance.
For plug-in hybrids, daily energy may be smaller and the engine provides another travel path. For long-range battery vehicles, the battery size itself does not determine daily charging; miles and desired reserve do.
Build at least four cases:
- median weekday;
- high-mile day followed by normal departure;
- consecutive high-mile days;
- cold or hot weather with battery/cabin conditioning.
Step 2: Measure the Available Dwell Window
Record actual arrival and departure times for two weeks. Subtract periods when the parking space, outlet, or vehicle is unavailable. If an off-peak tariff matters, calculate both the physical plug-in window and the cheaper pricing window.
Required average wall power is approximately:
Wall energy to replace ÷ usable charging hours
For 11.5 kWh of wall energy and a 10-hour window:
11.5 ÷ 10 = 1.15 kW average
That can fit within many Level 1 scenarios if the circuit, cord set, receptacle, temperature, and vehicle support reliable operation. The same energy in a three-hour off-peak window requires about 3.8 kW average, pointing toward Level 2.
Add margin for schedule variability and tapering or control delays. Do not size to an ideal arrival every night.
Step 3: Check Vehicle Acceptance and Equipment Limits
Find the exact vehicle's maximum AC charging input and supported current settings. A 48-amp EVSE does not deliver 48 amps to a vehicle whose onboard charger accepts less. Conversely, a future vehicle may accept more, but future-proofing has a cost in conductor, panel capacity, equipment, and possibly service.
Record:
- vehicle year, make, model, and AC acceptance;
- inlet/connector standard and any approved adapter requirements;
- portable cord-set ratings and plug type;
- EVSE output range and adjustable settings;
- hardwired or receptacle connection;
- cable length, storage, and connector holster;
- indoor/outdoor environmental rating;
- operating-temperature range;
- network or utility control features;
- safety certification and recall path.
ENERGY STAR notes that not all retail EVSE is safety certified and that certified models are evaluated by a nationally recognized testing laboratory. Verify the exact model in authoritative product records; do not rely on a marketplace logo image.
Level 1: When It Is Enough
Level 1 can be a good fit when:
- daily driving energy is modest;
- the vehicle remains parked for long overnight periods;
- the cord set and a suitable dedicated or appropriately assessed circuit are available;
- cold-weather conditioning does not consume the recovery margin;
- occasional high-mile days can be handled elsewhere or with extra time;
- no short off-peak window forces faster charging;
- the outlet and circuit can be inspected and maintained.
The word “standard outlet” should not imply unknown wiring is safe for sustained EV charging. Have the circuit, receptacle, terminations, grounding, protection, location, and other loads assessed according to local rules and the vehicle/EVSE instructions. A worn garage receptacle that has only powered small tools is not proven by visual appearance alone.
Level 1 acceptance test
Over at least seven representative nights, record:
- arrival/departure state of charge;
- wall kWh and charging duration;
- interruptions or reduced-current events;
- vehicle warnings;
- plug, receptacle, cord, and EVSE condition;
- ambient temperature;
- departure readiness;
- other circuit use.
Stop and obtain qualified help for heat, odor, discoloration, looseness, buzzing, arcing, damage, repeated trips, or fault indications. Do not defeat protective devices or reduce current merely to conceal a damaged connection.
Level 2: When Faster Recovery Adds Value
Level 2 can be justified when:
- Level 1 cannot replace routine daily energy in the dwell window;
- winters create repeated departure shortfalls;
- the home has two EVs or a vehicle with high daily utilization;
- the utility's low-cost window is shorter than the parking window;
- managed charging must fit other large electrical loads;
- occasional deep battery recovery must occur at home;
- preconditioning from the grid is important for departure;
- the installation will serve a multiunit, rental, or future vehicle plan.
Choose the lowest output that reliably meets the service requirement after margin. A 16-, 24-, or 32-amp Level 2 solution may be more proportionate than the maximum supported output and may avoid unnecessary electrical work. The exact options depend on applicable codes, equipment, and circuit design.
Charging Efficiency: Measure the Whole Session
Charging losses can include EVSE standby, vehicle electronics, onboard conversion, battery heating/cooling, pumps, wiring, and battery electrochemistry. A fixed overhead can represent a larger share at low charging power, and ENERGY STAR says Level 2 is on average more efficient than Level 1. That does not support assigning every car a fixed 21% versus 4% loss.
Measure:
Session efficiency = battery energy added ÷ wall energy delivered
Use compatible data sources and note uncertainty. Vehicle “energy added” may be estimated, rounded, or reported at the battery, while EVSE kWh may have its own accuracy specification. State of charge is not always linear with usable energy.
Example method:
- EVSE reports 14.2 kWh from wall;
- vehicle reports 12.5 kWh added under the same session boundary;
- apparent session efficiency = 12.5 ÷ 14.2 = 88%.
Repeat across several sessions at Level 1 and Level 2 with similar starting state, energy added, temperature, and conditioning. If the difference is close to measurement uncertainty, do not claim precision the tools cannot support.
Why short sessions can look worse
When the vehicle repeatedly wakes, conditions the battery, negotiates charging, and ends after adding little energy, fixed session overhead can be material. Consolidating charging sessions may help some vehicles, but follow manufacturer guidance and mobility requirements. Do not delay charging below a safe travel reserve merely to optimize a percentage.
Cold-Weather Charging
Cold batteries may accept power differently, and the vehicle may use energy to heat the battery and cabin. Level 1's lower available power can leave less for net battery charging during conditioning. The outcome is vehicle- and temperature-specific.
Create a winter test:
- outdoor/garage temperature;
- arrival battery temperature information if available;
- arrival/departure state of charge;
- wall kWh;
- conditioning and cabin-preheat settings;
- charging start/end;
- energy still required at departure.
Test before the coldest expected period if possible. A Level 1 strategy that works in autumn may fail during repeated cold, high-mile days. A garage may moderate temperature, but ventilation, fire separation, parking, and building rules remain relevant.
Electrical Capacity: Avoid the Automatic Panel Upgrade
EV charging is a substantial, long-duration load. A qualified electrical assessment should address service and feeder capacity, panel condition and space, load calculation, circuit routing, conductor and termination ratings, voltage drop, protective devices, grounding, surge/environmental conditions, and local permit/inspection.
Possible solutions when maximum charging does not fit include:
- lower EVSE current sized to the actual daily need;
- listed load-management equipment designed for the application;
- sharing capacity between two EVSE under an approved system;
- utility-managed charging where terms are acceptable;
- a dedicated service or panel work where justified.
Do not treat a software slider in an app as the only required electrical protection. Fixed settings, commissioning, labels, access control, and local code requirements matter. Use the panel-capacity electrification guide to frame the assessment.
Hardwired vs. Receptacle-Connected Level 2
Both can be valid where permitted and installed correctly. Compare:
| Question | Hardwired | Receptacle-connected |
|---|---|---|
| Connection count | Fewer plug contacts | Adds receptacle/plug interface |
| Portability | Requires disconnection work | EVSE can be unplugged as allowed |
| Environmental sealing | Model/installation specific | Receptacle/enclosure also critical |
| Circuit protection | Per local rules | May have additional requirements |
| Inspection/maintenance | Terminations/equipment | Adds receptacle contact inspection |
| Rental/future flexibility | Lower | Potentially higher |
Do not use a dryer receptacle casually, share by repeated manual plugging, add an unapproved splitter, or run an extension cord unless the vehicle/EVSE and applicable rules explicitly provide for the configuration. Frequent connection cycles, unknown circuit loads, old receptacles, and improvised adapters create risk.
Location and Cable Management
The safest, most efficient electrical design can still fail operationally if the cable crosses a walkway, sits in snow, cannot reach without tension, or encourages backing over the connector.
Record:
- usual vehicle parking orientation;
- charge-port location on current and plausible future vehicles;
- cable route with all doors and garage movement;
- wall or pedestal mounting surface;
- weather, drainage, snow, ice, sun, and impact exposure;
- bollard or physical protection needs;
- accessibility and connector height;
- door/garage fire-separation penetrations;
- Wi-Fi/cellular signal only if required;
- emergency disconnect and maintenance access.
Do not route a charging cable through a closed window or door that can crush it. Do not leave loops where people can trip or snow equipment can catch them.
Time-of-Use and Managed Charging
Charging schedule can change cost without changing kWh. Obtain the official tariff and model:
- all import prices and periods;
- seasons, weekends, and holidays;
- fixed and meter charges;
- demand charges or peak events;
- EV-specific eligibility and separate-meter cost;
- utility control, override, and incentive terms;
- solar export treatment;
- switch-back rules.
A shorter off-peak window can strengthen the case for Level 2. A very high Level 2 rate can also create a sharp household peak or exceed managed capacity. Choose a current that completes charging with margin inside the desired window, not automatically the fastest.
Use the TOU interval-data model for the complete calculation.
Installed-Cost and Five-Year Ledger
| Cost or value | Level 1 | Level 2 option A | Level 2 option B |
|---|---|---|---|
| EVSE/cord equipment | |||
| Electrical assessment | |||
| Circuit, conductor, protection | |||
| Trenching/conduit/repair | |||
| Panel/service/load management | |||
| Permit and inspection | |||
| Network/subscription | |||
| Annual wall kWh | |||
| Annual tariff cost | |||
| Maintenance/repair | |||
| Public charging avoided/added | |||
| Recovery reliability | |||
| Five-year total |
Use written quotes and a low/base/high installation allowance. Long cable runs, trenching, finished-wall repair, old panels, multiunit approvals, and utility work can dominate the equipment price.
Efficiency-only break-even
If measured Level 2 wall energy is 180 kWh/year lower for the same battery energy and electricity costs $0.20/kWh, the annual difference is $36. A $1,400 installed premium has an energy-only simple payback of almost 39 years. The Level 2 case may still be strong for readiness, winter recovery, schedule, or a future vehicle—but label those benefits instead of inventing a four-year energy payback.
Conversely, high annual driving, a larger measured efficiency gap, and a favorable off-peak tariff can improve the economics. Use actual inputs.
Incentive and Utility Verification
Treat incentives as zero until confirmed for the exact address, customer, equipment, installer, permit, date, and tariff. Save:
- official program rules and effective date;
- qualifying product list;
- pre-approval requirement;
- installation/inspection documentation;
- network or demand-response enrollment terms;
- payment timing and funding status;
- tax-credit eligibility from authoritative tax guidance.
Do not select a more expensive connected EVSE solely for an incentive if the required subscription, utility control, data sharing, or tariff reduces its value.
Commission the Installation
Keep a signed record:
- exact EVSE model/serial and certification;
- circuit rating and configured maximum current;
- conductor, breaker, protective equipment, and disconnect as applicable;
- permits and inspection closure;
- mounting, cable storage, clearances, and weather protection;
- measured voltage/current and any voltage drop under charge, using appropriate methods;
- connector, receptacle/termination, and enclosure condition;
- network, schedule, load management, and outage recovery;
- vehicle handshake and full representative session;
- owner instructions and emergency contact.
Recheck after early use and periodically as instructed. Stop for heat, odor, discoloration, damage, nuisance trips, water entry, or fault codes.
Diagnose a Charge That Is Slower Than Expected
Do not assume the EVSE is defective from a miles-per-hour display. Follow the energy path:
- Confirm the vehicle's configured AC current and charge limit.
- Confirm the EVSE's commissioned maximum and any utility or load-management limit.
- Record voltage, current, wall kWh, session time, and interruptions using appropriate equipment.
- Check battery temperature, cabin preconditioning, and state of charge.
- Review whether charging tapered or stopped at a vehicle schedule.
- Check whether the EVSE lost network time, entered a demand-response event, or shared capacity.
- Inspect connector, cable, receptacle where used, protective equipment, and fault history without opening energized equipment.
Possible causes include a vehicle current setting, cold-battery conditioning, a high state of charge, shared-circuit management, voltage conditions, a loose or overheating connection, thermal derating, utility control, or incompatible schedules. Repeated trips, heat, odor, discoloration, arcing, water entry, or damage require stopping use and qualified assessment.
Keep screenshots and timestamps. The vehicle, EVSE, utility, and electrician may each see only part of the event; a synchronized log lets them compare evidence.
Plan for Outages and Network Failure
A connected EVSE should have a documented safe state after loss and restoration of power, internet, local network, or cloud service. Test only in ways allowed by the manuals and installer:
- whether the relay remains off or resumes;
- whether the current limit persists;
- whether schedules keep local time;
- whether load management continues safely;
- whether manual charging remains possible;
- whether accumulated energy history is retained;
- whether the vehicle and EVSE recover without repeated cycling.
Do not let a cloud failure bypass an electrical capacity limit. Critical load management should rely on listed, approved equipment and commissioning—not an informal automation. If home backup is planned, the EV charging circuit may need deliberate shedding so it does not overload an islanded system.
Keep a Seasonal Operating Record
For the first year, save one representative week from each season. Record daily miles, wall kWh, departure readiness, tariff period, ambient temperature, faults, and any public charging used because home recovery fell short. This reveals whether the original Level 1 or Level 2 case remains valid.
Revisit the design when a second EV arrives, commute changes, a heat pump or electric water heater is added, the utility tariff changes, the parking space moves, or the EVSE/vehicle receives control updates. Charging infrastructure is part of the household electrical plan, not a one-time appliance purchase.
Decision Patterns
Plug-in hybrid, 20 miles most weekdays
Long nightly dwell and small energy use make a properly assessed Level 1 circuit a strong starting point. Test winter readiness before installing Level 2.
Battery EV, 65-mile commute with short off-peak period
Daily energy and schedule likely justify Level 2. Calculate the minimum current that completes the charge window, then evaluate capacity and load management.
Remote worker with occasional 200-mile weekend
Level 1 may cover routine use while occasional public charging handles the rare recovery day. Compare several years of public-charge cost/inconvenience with the Level 2 installed premium.
Two EV household
Do not automatically install two maximum circuits. Model arrival, daily energy, priority, shared power, sequential charging, and departure requirements. A listed networked load-sharing design may deliver better use of existing capacity.
Rental or condominium
Obtain written parking, metering, electrical, fire-separation, accessibility, insurance, utility, and removal approvals. Ownership of equipment, electricity billing, maintenance, and future residents must be explicit.
Frequently Asked Questions
Is Level 2 always more efficient?
ENERGY STAR reports an average efficiency advantage, but the exact difference varies by vehicle, temperature, battery state, power, session length, conditioning, wiring, and measurement boundary. Measure comparable sessions.
Do I need a 50-amp outlet?
Not automatically. Size charging to daily energy, dwell time, vehicle acceptance, and electrical capacity. The appropriate circuit and connection must follow the EVSE, vehicle, and local requirements.
Can I use Level 1 forever?
Yes, if it safely and reliably meets normal, recovery, and winter cases. Reassess when driving, vehicle, tariff, parking, or household electrification changes.
Does Level 2 damage the battery?
AC Level 2 operates within the vehicle's onboard charging controls. Follow the vehicle manufacturer's charging and state-of-charge guidance. Do not confuse AC Level 2 with DC fast charging.
Can I schedule charging from both the car and EVSE?
You can, but overlapping schedules can cause missed charging. Choose one primary scheduler, document utility/load-management constraints, and test outage and clock behavior.
Should I upgrade the panel for future-proofing?
Only after a load calculation and comparison with lower-current charging, approved load management, and realistic future loads. Oversizing stranded infrastructure is not free future-proofing.
How much range will I add per hour?
Published ranges are estimates. Calculate wall power, session efficiency, and the vehicle's energy per mile under your conditions. Track energy and departure readiness rather than relying on one miles-per-hour figure.
What to Read Next
Confirm the house boundary with the electrical panel capacity guide, model charging hours with the TOU rate worksheet, plan the circuit using the home EV charging installation guide, and assess backup claims with the vehicle-to-home guide.
About the Editorial Team EnergyBS reviews public program rules, product specifications, utility rates, and reader-facing cost assumptions. Treat savings figures as estimates until you verify local prices, permits, rebates, and contractor quotes.
Sources and Verification
- ENERGY STAR: Electric Vehicle Chargers
- ENERGY STAR: Make Your Home Electric Ready
- DOE Alternative Fuels Data Center: Charging Infrastructure Procurement and Installation
- DOE Alternative Fuels Data Center: Charging Electric Vehicles at Home
- DOE FEMP: Purchasing EnergyEfficient Electric Vehicle Supply Equipment
- ENERGY STAR: Certified EV Charger Product Finder
- CPSC: Home Electrical Safety Checklist
Editorial Review
EnergyBS Editorial Team
EnergyBS publishes practical homeowner guides. Important program, product, and cost claims should be checked against the linked source and local project documents before you commit to work.
Related Guides
View All ArticlesElectrical Panel Capacity for Home Electrification
A decision guide for homeowners adding heat pumps, EV charging, induction, water heating, solar, or batteries: service ratings, load calculations, demand data, panel space, load management, project sequencing, and quote review.
Are TimeofUse Rates Worth It? Model Your Bill From
Use a year of interval data and current tariff rules to compare flat and timeofuse electricity plans. Includes a bill model, loadshift inventory, demandcharge check, and trial scorecard.
The 2026 EV Home Charging Handbook 2026 Tool
A practical 2026 home EV charging guide covering Level 2 circuits, hardwired chargers, load management, bidirectional backup, and when a panel upgrade is avoidable.