Are TimeofUse Rates Worth It? Model Your Bill From
Use a year of interval data and current tariff rules to compare flat and timeofuse electricity plans. Includes a bill model, loadshift inventory, demandcharge check, and trial scorecard.
Direct Answer
Use a year of interval data and current tariff rules to compare flat and timeofuse electricity plans. Includes a bill model, loadshift inventory, demandcharge check, and trial scorecard.
A Time-of-Use Plan Is Worth It Only If Your Data Says So
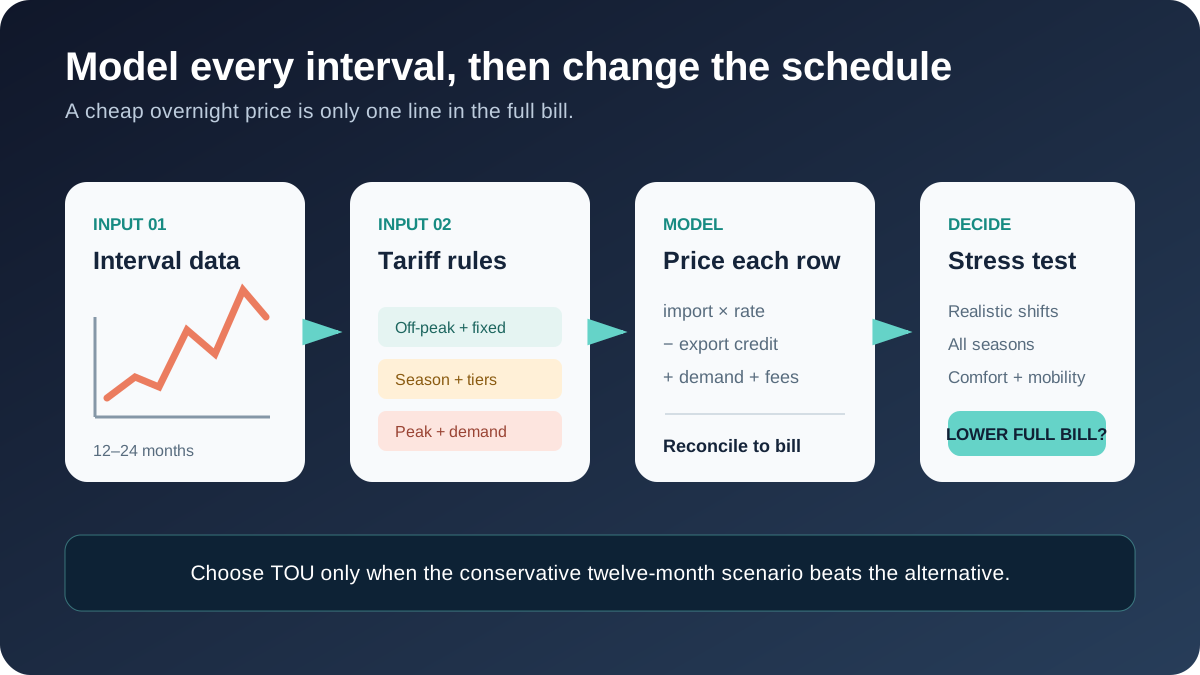
Short answer: Download at least 12 months of hourly or 15-minute electricity use, obtain the current tariff sheets for every eligible plan, and price each interval under each plan. Include fixed charges, seasonal calendars, holidays, tiers, credits, taxes, minimum bills, and any demand charge. Then model only the load shifts your household can sustain. A low overnight rate does not guarantee a lower bill if evening cooling, cooking, or heating moves more kilowatt-hours into an expensive period.
Time-of-use (TOU) pricing assigns predetermined prices to blocks of time. It differs from a flat energy rate, real-time price, critical-peak price, or peak-time rebate. DOE describes TOU as one form of time-variable pricing that encourages customers to move or reduce load when electricity is expensive. The concept is simple; the bill is not.
This guide is a personal rate simulator and operating plan. For a broader overview of flat, tiered, TOU, dynamic, and supplier-plan structures, start with the utility rate-plan guide.
Collect the Tariff Before Modeling Behavior
Do not copy peak hours or example prices from an article. Rate schedules vary by utility, regulator, customer class, season, weekday, holiday, location, meter, and equipment enrollment. Download the utility's current tariff or rate sheet and save the effective date.
For each eligible plan, record:
- energy prices for every period;
- the exact start and end times;
- weekday, weekend, and holiday definitions;
- summer and winter season dates;
- tier thresholds or baseline allowances;
- fixed customer and meter charges;
- minimum-bill rules;
- demand charges and their measurement interval, if any;
- credits, riders, fuel adjustments, and taxes;
- export compensation for solar customers;
- EV, heat-pump, or other equipment eligibility;
- enrollment term, trial, and switch-back rules;
- whether daylight-saving-time transitions affect interval mapping.
Treat marketing summaries as navigation, not the calculation source. A plan advertised as “nine-cent overnight charging” may carry a higher peak price, a new fixed charge, an EV-meter cost, or different delivery charges. Price the entire bill.
Distinguish the rate types
| Rate feature | How it works | Main modeling risk |
|---|---|---|
| Flat energy price | One energy price across hours, sometimes with tiers | Future seasonal or tier changes |
| Time of use | Fixed time blocks with different prices | Misclassifying seasons, weekends, or holidays |
| Critical peak pricing | Very high price during called events | Missing event frequency or notification rules |
| Peak-time rebate | Credit for reducing against a calculated baseline | Assuming the baseline or payment is guaranteed |
| Real-time/hourly pricing | Price follows a published market-linked schedule | Using historic prices as a forecast |
| Demand charge | Fee based on highest kW interval under stated rules | Modeling only kWh and ignoring coincidence |
Some plans combine several features. A residential tariff can include TOU energy prices plus a monthly demand charge, fixed charge, and export credit. Build all of them.
Download Interval Data
Monthly kilowatt-hours cannot show when energy was used. Advanced meters often record hourly or 15-minute intervals. DOE recommends interval data when comparing rate options because it reveals both load magnitude and load shape.
Look in the utility portal for “usage history,” “interval data,” “download my data,” CSV, or Green Button. The Green Button Download My Data standard provides usage in a consistent XML format where the utility supports it; Green Button Connect My Data allows customer-authorized transfer to a third party. Availability and interval length vary.
Download:
- at least 12 complete months, preferably 24;
- energy delivered from the grid;
- energy exported, if applicable;
- timestamps, interval duration, and time zone;
- billing-quality or reading-status fields where supplied;
- demand readings if the tariff uses them;
- matching utility bills for reconciliation.
Utility-use data can reveal occupancy patterns and should be treated as sensitive. Remove account identifiers before sharing and authorize only services you trust. A local spreadsheet can perform the core comparison without sending data to a vendor.
Reconcile before calculating
Sum the intervals for each billing period and compare them with billed kWh. Investigate differences caused by meter multipliers, estimated reads, netting conventions, time zones, missing intervals, billing-period boundaries, or corrections. A rate model that does not reproduce the energy portion of the current bill is not ready to compare alternatives.
Build the Interval-by-Interval Bill Model
For interval i, the basic TOU energy cost is:
interval kWh × price assigned to that timestamp
Then sum all intervals and add the other tariff components. In conceptual form:
Modeled bill = fixed charges + Σ(interval imports × applicable import price) − export credits + demand charges + other tariff adjustments
Do not apply an hourly price directly to interval kW. For a 15-minute interval, average power of 4 kW equals 1 kWh of energy. The file may report energy, average demand, cumulative readings, or several channels; verify the units.
Minimum spreadsheet columns
| Column | Purpose |
|---|---|
| Timestamp start/end | Places the use in the correct local period |
| Interval duration | Converts demand to energy where necessary |
| Import kWh | Prices consumption |
| Export kWh | Prices solar or battery export separately |
| Month and season | Applies seasonal tariff rules |
| Weekday/weekend/holiday | Applies calendar rules |
| TOU period | Peak, shoulder, off-peak, or named tariff block |
| Import price | Current charge for that interval |
| Export price | Current credit for that interval |
| Interval cost | Energy subtotal |
| Shift scenario label | Identifies modeled changes |
Keep a tariff-input sheet separate from interval calculations. That makes it easier to update prices without rewriting formulas.
Worked Example: Why the Overnight Price Can Mislead
Consider a hypothetical month with 900 kWh:
- 250 kWh in a peak block at $0.38/kWh;
- 550 kWh in an off-peak block at $0.15/kWh;
- 100 kWh in a super-off-peak block at $0.10/kWh.
TOU energy charges are:
- 250 × $0.38 = $95.00;
- 550 × $0.15 = $82.50;
- 100 × $0.10 = $10.00;
- total = $187.50 before other charges.
At a hypothetical flat $0.16/kWh, the energy charge would be $144. The TOU plan loses by $43.50 before fixed-charge differences.
Now shift 100 kWh from peak to off-peak without changing total consumption:
- peak: 150 × $0.38 = $57.00;
- off-peak: 650 × $0.15 = $97.50;
- super-off-peak: $10.00;
- total = $164.50.
The shift saves $23 under TOU, yet the plan still costs $20.50 more than the flat example. The household needs either more shiftable load, lower total use, or a different plan. “We own an EV” is not a sufficient conclusion.
Find the Break-Even Peak Share
For a simplified two-period plan with no other differences:
TOU average price = peak share × peak price + (1 − peak share) × off-peak price
Set that equal to the flat price and solve:
Break-even peak share = (flat price − off-peak price) ÷ (peak price − off-peak price)
With flat $0.16, peak $0.38, and off-peak $0.15:
Break-even share = ($0.16 − $0.15) ÷ ($0.38 − $0.15) = about 4.35%
Under that extreme example, nearly all energy must avoid peak for TOU to win. With a narrower price spread, the break-even share rises. This shortcut is useful for screening but cannot represent seasons, three periods, tiers, fixed charges, or exports.
Create a Load-Shift Inventory
Model each flexible end use from energy and timing, not appliance wattage alone.
| Load | Evidence to collect | Plausible control | Constraint to preserve |
|---|---|---|---|
| EV charging | Arrival/departure state of charge, daily miles, charger data | Scheduled or managed charging | Required departure range |
| Water heating | Circuit/submeter data, draw times, tank size | Preheat or utility-enabled control | Hot-water availability, sanitation, manufacturer limits |
| Clothes drying | Loads per week and cycle timing | Delay to off-peak/weekends | Noise, fire safety, household schedule |
| Dishwasher | Cycle energy and finish time | Delay-start | Noise and unloading needs; diagnose repeated drain or drying failures before shifting them with the dishwasher repair decision guide |
| Pool/spa pump | Run duration and required turnover | Reschedule | Water quality and equipment limits |
| Space cooling | Weather, runtime, indoor temperature, humidity | Modest pre-cooling and wider peak band | Comfort, humidity, equipment capacity |
| Space heating | Weather, heat-pump stage and backup use | Small preheat or steady operation | Comfort and avoidance of resistance backup |
| Battery/V2H | Usable capacity, efficiency, reserve, export rules | Charge/discharge schedule | Outage reserve, warranty, driving needs |
The shiftable energy for an appliance is not its nameplate kW multiplied by the entire peak window. Use logged runtime or circuit data. A 5 kW dryer running 45 minutes consumes about 3.75 kWh for that cycle, not 25 kWh because the peak block lasts five hours. When replacement is due, the heat-pump dryer comparison shows how to combine model kWh, loads per week, cycle time, drainage, and vent costs instead of comparing nameplate power alone.
Prioritize Loads by Value and Friction
The value of shifting one kilowatt-hour is approximately:
peak import price − off-peak import price, adjusted for any added losses or changed consumption.
Rank actions by annual shiftable kWh times that spread, then subtract equipment costs and inconvenience.
Usually low-friction
- EV charging scheduled after the off-peak start, with a departure target;
- dishwasher delay-start;
- pool or circulation pump scheduling where safe;
- laundry moved to a weekend if weekends are off-peak.
Needs more modeling
- HVAC preheating or pre-cooling;
- heat-pump water-heater control;
- stationary battery or V2H cycling;
- thermostat participation in a utility event program;
- any shift that creates a new monthly demand peak.
Start with controls already included in appliances. Buying automation for a tiny shift may never pay back.
HVAC: Shift Thermal Load Without Creating a Bigger Problem
Pre-cooling can move compressor runtime before a peak period because the building and furnishings store some cooling. Results depend on envelope, solar gain, humidity, equipment capacity, weather, and comfort tolerance. A universal instruction to cool to 70°F and then coast to 78°F is not appropriate for every occupant or house.
Test a modest change, such as one or two degrees, and record:
- indoor temperature by room;
- indoor humidity;
- compressor and fan runtime;
- peak-period kWh;
- rebound energy after the peak;
- comfort complaints;
- whether a heat pump calls auxiliary resistance heat during recovery.
In humid climates, excessive fan operation or aggressive temperature swings may affect moisture control. In cold climates, a deep setback followed by recovery can activate expensive backup heat. Follow equipment guidance and preserve health needs.
Measure savings across similar weather or use a weather-normalized comparison. A cooler week after changing the schedule can look like a tariff success when weather caused the reduction.
EV Charging: Model Energy Need Before Charging Power
An EV owner often has the largest flexible residential load, but charging speed is not the same as daily energy need. Estimate:
daily charging energy = daily distance ÷ vehicle efficiency + charging losses
Then check whether the off-peak window can deliver it at a lower current. A car needing 12 kWh over an eight-hour overnight window averages only 1.5 kW before losses. Higher-power Level 2 charging may be convenient after unusual travel but unnecessary every night.
Use vehicle or charger scheduling, confirm the clock and time zone, and set a departure target. PNNL's residential EV charging guidance notes that networked chargers can support TOU programs, while some households can use the vehicle's onboard timer without a subscription.
If charging shares capacity with other appliances, coordinate the TOU schedule with the home's load-management rules. Starting the EV, dryer, and water heater at the exact off-peak boundary can create a high demand interval even though energy is cheap.
Water Heating: Store Heat, Not Just Electricity
A tank water heater stores thermal energy. A sufficiently sized tank can heat before a peak window and serve draws during it. Heat-pump water heaters add a complication: forcing rapid recovery can energize resistance elements and erase savings.
Use the heat-pump water-heater readiness guide to check tank size, first-hour rating, operating mode, resistance backup, and available controls. Keep water-temperature settings within manufacturer and public-health guidance, and use scald protection where required. Do not disable required heating cycles or safety controls.
Demand Charges Change the Objective
An energy charge bills kWh. A demand charge bills a measured kW peak under tariff rules, often the highest interval in a month or specified window. Shifting all flexible appliances to the same off-peak start can reduce energy charges but increase the demand charge.
Example: an EV charger at 7.2 kW, dryer at 5 kW, and water heater at 4.5 kW overlap for one interval. Their combined contribution is 16.7 kW before the rest of the house. If the plan bills the maximum 15-minute demand, one short coincidence can affect the whole month.
When a demand charge applies:
- stagger appliance start times;
- cap EV charging power;
- use approved load management;
- calculate the bill from interval kW as the tariff defines it;
- check ratchets or minimum demand rules;
- retain headroom for heating and cooling.
Do not assume residential demand charges exist or do not exist; read the plan.
Solar Export and TOU Need Separate Channels
Solar production and household load occur simultaneously, while the meter records net import/export according to local rules. A TOU plan can change both the value of imported energy and the value of exports.
Model at the meter interval:
- grid import after onsite solar;
- grid export after onsite load;
- import price for that timestamp;
- export credit for that timestamp;
- non-bypassable charges or annual true-up rules;
- battery charging source and export restrictions.
Do not assume solar exports receive the retail TOU price. Do not assume a battery charged from the grid may later export under the tariff. Verify interconnection and program terms.
Battery and V2H Arbitrage: Include Losses and Reserve
If energy is bought off-peak, stored, and discharged to avoid peak import, the value per delivered kWh must account for round-trip efficiency:
net value per delivered kWh ≈ peak price avoided − (off-peak price ÷ round-trip efficiency)
At $0.40 peak, $0.12 off-peak, and 85% round-trip efficiency:
$0.40 − ($0.12 ÷ 0.85) = about $0.259 per delivered kWh
Multiply by realistic usable throughput and eligible days, then subtract degradation, standby use, subscription fees, fixed charges, and capital cost. Preserve an outage reserve and, for V2H, the vehicle's driving requirement. The V2H compatibility and runtime guide provides that worksheet.
Arbitrage alone may not justify storage. Resilience, solar self-consumption, demand-charge reduction, or program payments can add value, but each must be modeled under actual rules.
Avoid Unsafe Automation
Do not put high-current appliances, HVAC equipment, water heaters, space heaters, or EV charging on generic plug-in smart switches unless the appliance, controller, circuit, and installation are explicitly listed and approved for that use. Compressor and heating equipment can be damaged or made unsafe by interrupting power improperly. Use native controls, listed energy-management equipment, or professionally designed systems.
Cloud dependence is another operational risk. Confirm what schedules and safety limits remain when internet service or a vendor platform is unavailable.
Run a Four-Week Trial
Where the utility permits switching back without penalty, validate the modeled plan.
Week 1: Baseline
Keep normal behavior and tag major loads in the interval data. Confirm the current plan model reproduces the bill.
Week 2: Low-friction shifts
Schedule EV charging, dishwasher, laundry, and pumps. Do not alter HVAC yet. Record peak kWh and missed appliance needs.
Week 3: Thermal loads
Test modest HVAC and water-heating changes within comfort and equipment limits. Log temperature, humidity, hot-water availability, and backup heat.
Week 4: Stress and fallback
Test a busy household day. Verify schedules after a power or internet interruption if manufacturer instructions permit. Confirm the car is ready, hot water is available, and no load starts unexpectedly at the peak boundary.
Compare both cost and usability.
| Trial metric | Baseline | TOU operation | Pass condition |
|---|---|---|---|
| Peak-period kWh | Reduced as modeled | ||
| Monthly energy charges | Lower after full tariff | ||
| Demand charge | No unexpected increase | ||
| Total kWh | No large rebound without explanation | ||
| Indoor comfort/humidity | Within household limits | ||
| EV departure state | Target met | ||
| Hot-water service | Target met | ||
| Manual interventions | Sustainable workload |
Recalculate When the House Changes
Review the plan after:
- utility price or calendar updates;
- adding an EV or changing commute;
- heat-pump or water-heater installation;
- solar or battery installation;
- occupancy or work-schedule changes;
- a major weather or comfort change;
- entering or leaving a demand-response program.
Use a full year because a plan can win in winter and lose in summer. Compare like-for-like tariff years and state assumptions about future price changes rather than treating them as facts.
Questions to Ask the Utility
- Which residential plans is this meter eligible for today?
- Can you provide a historical bill comparison using my interval data?
- Which charges change by period, season, tier, or demand?
- How are weekends, holidays, and daylight-saving transitions treated?
- Are solar exports credited differently by hour?
- Are batteries allowed to charge from the grid and export?
- Is a separate meter or enrollment agreement required for the EV rate?
- Are critical events or demand-response calls part of the plan?
- What are the term, switch-back, and re-enrollment rules?
- When is the next approved rate change?
Save the response and tariff with the model date.
Frequently Asked Questions
Do TOU rates always save EV owners money?
No. The EV adds off-peak load, but the plan reprices the entire house. Model all intervals, charges, and seasons. A lower charging rate can be outweighed by expensive evening cooling or heating.
How much data do I need?
Use at least 12 months to capture heating, cooling, holidays, and seasonal schedules. Two years helps identify unusual weather or occupancy, but use current behavior and tariff rules.
Can I compare plans from monthly bills?
Only approximately. Monthly kWh lacks timing. A utility's official comparison tool may use meter intervals behind the scenes; otherwise request hourly or 15-minute data.
Should I buy a home energy monitor?
Utility interval data is enough to price the meter-level bill. Circuit monitoring can help identify which appliance creates a peak, but it should be installed safely and its data reconciled with the utility meter.
Does shifting a load save energy?
Not necessarily. It changes when energy is used. Some controls also change total consumption through losses, rebound, or altered setpoints. Track both kWh and cost.
Are weekends always off-peak?
No. Many tariffs treat them differently, but the exact calendar comes from the current rate sheet.
Is the cheapest plan also best for the grid or emissions?
Not always. Retail price signals, system demand, and marginal emissions can differ. Decide whether the objective is bill savings, peak reduction, emissions, resilience, or a combination, and do not claim one metric from another.
The Decision Rule
A TOU plan is a good candidate when the full-year interval model beats the alternative after every tariff component, the savings remain under conservative load-shift assumptions, and the operating schedule preserves comfort, safety, hot water, and mobility. Keep the flat or other plan when savings depend on perfect daily behavior, one promotional price, or a battery payback that ignores losses and reserve.
The durable advantage is not “never use electricity at 6 PM.” It is knowing which loads are flexible, automating them within real constraints, and checking the result against the bill.
About the Editorial Team EnergyBS reviews public program rules, product specifications, utility rates, and reader-facing cost assumptions. Treat savings figures as estimates until you verify local prices, permits, rebates, and contractor quotes.
What to Read Next
Electricity Rate Plans Explained 2026 Tool (Guide & Data)Use this next to compare the cost, incentive, installation, or operating-risk angle before you make a home energy decision.Sources and Verification
Editorial Review
EnergyBS Editorial Team
EnergyBS publishes practical homeowner guides. Important program, product, and cost claims should be checked against the linked source and local project documents before you commit to work.
Related Guides
View All ArticlesElectricity Rate Plans Explained 2026 Tool (Guide & Data)
A billfirst framework for comparing flat, tiered, timeofuse, criticalpeak, realtime, demand, EV, and retailsupplier plans without relying on headline cents per kWh.
How to Read Your Electric Bill 2026 Tool (Guide & Data)
Your electric bill is full of confusing charges, fees, and acronyms. Here's a linebyline breakdown of what you're actually paying for—and where to find savings.
The 2026 Solar Battery ROI strong example 2026 Tool
Home batteries are no longer a backup luxury; they are the core of solar profitability. We analyze LFP chemistry, Virtual Power Plant (VPP) revenue, and why the 'Grid as a Battery' is officially dead.